Website or server monitoring is important to keep you as their owner informed when something goes wrong. For example, your online shop stops working. In most cases, it takes several hours before the site owners realize something’s wrong. Online shops can lose many orders in the meantime and SEO ranking can suffer, too.
You have two options when it comes to monitoring your website: local monitoring (on the same server as your website), or external monitoring. Local monitoring is usually included in the price of web hosting, while external monitoring comes with additional costs. But when there are issues not only with your website, but with the server itself, local monitoring is unable to perform effectively. External monitoring is the only reliable option in this case for obvious reasons. Even if the entire server is down, you’ll still get a notification about the issue without delay. This way, you can minimize server downtime and avoid any damage that this could cause to your business.
This is why we provide 360 Monitoring, a complete full functional monitoring solution for websites and servers, already integrated with Plesk. Let’s see how you can activate it.
360 Monitoring Activation Guide
1. Create an Account
First you need to register an account on our SaaS platform, platform360.io. If you have an account in our Technical Support system, you can skip this step because it’s the same SSO account and you can use it in Plesk to connect the server to 360 Monitoring.
Note: If you want to enable 360 Monitoring for a Windows server you should go directly to platform360.io website.
2. Connect to Plesk 360
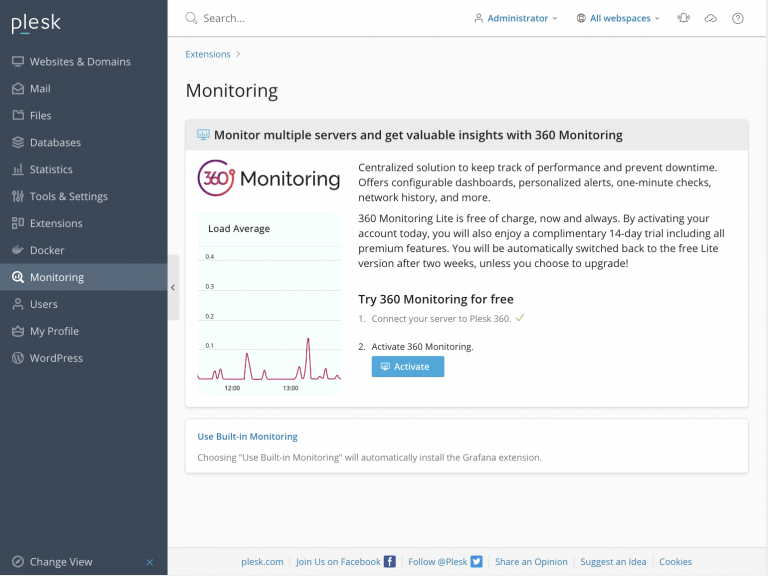
Now that you have your account, open Plesk Monitoring from the left menu and click “Connect”.
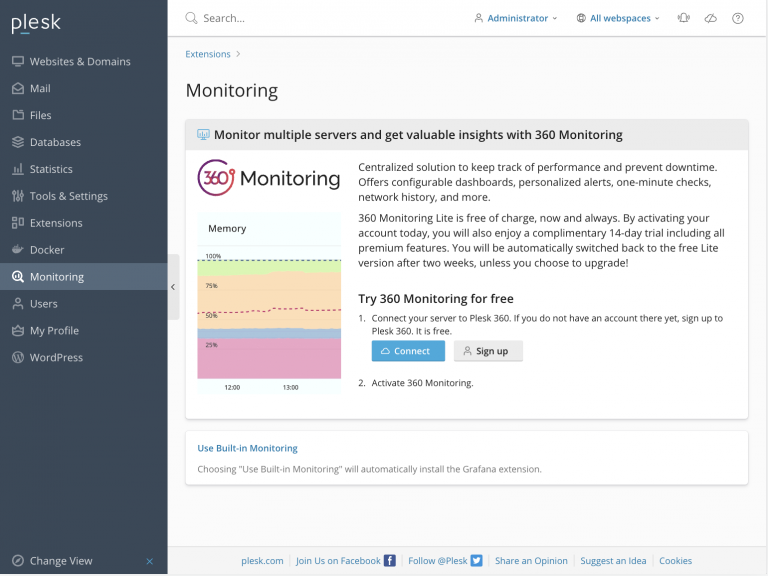 The default Plesk Monitoring page[/caption]
After clicking on the “Connect” button, you’ll be redirected to the platform360.io website to confirm the connection between the Plesk server and the website.
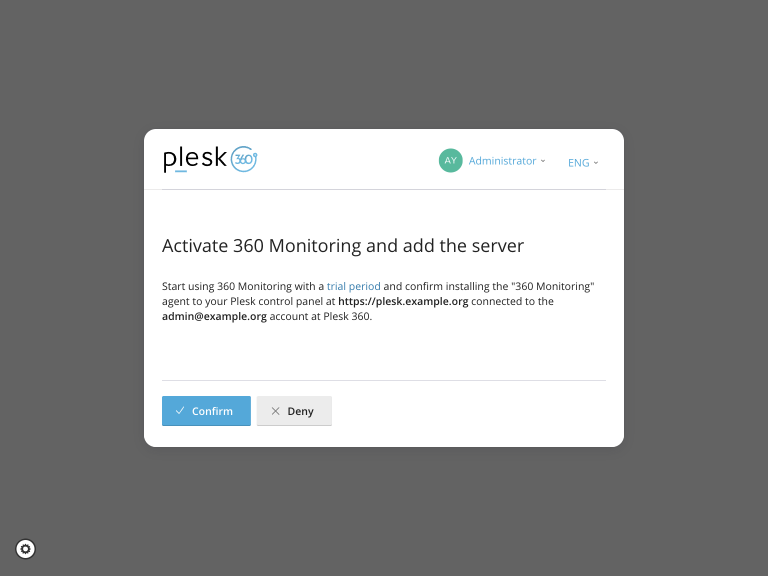
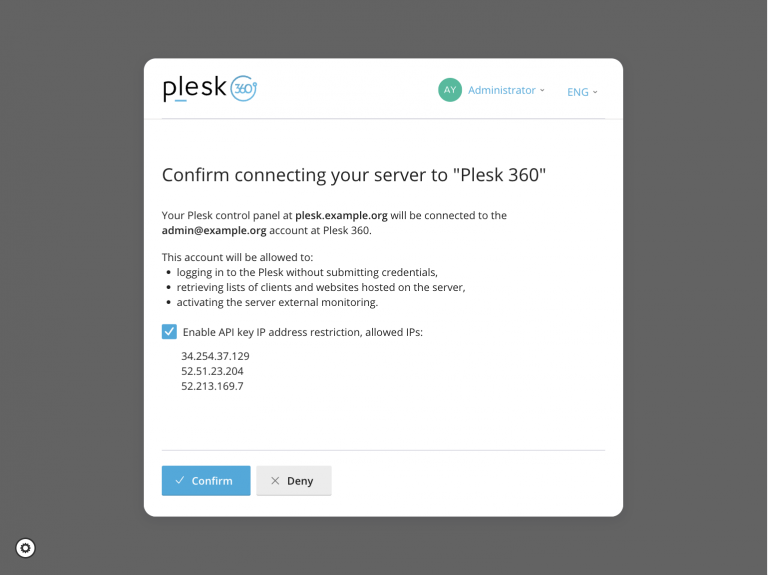 The confirmation page[/caption]
After confirming, the server will be added to the Server Inventory.
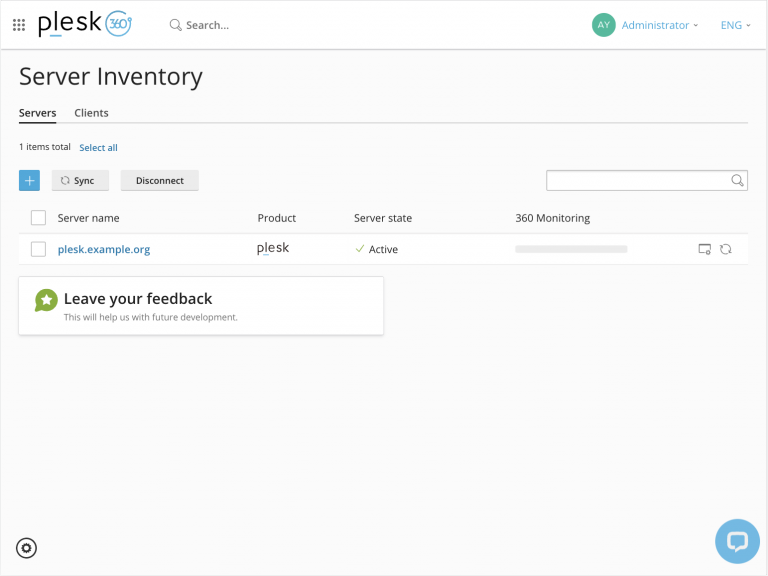 The Plesk 360 website[/caption]
3. Activate 360 Monitoring
The next step is to activate 360 Monitoring. Open the Plesk Monitoring extension again. The first step should be marked as completed and the “Activate” button should appear.
Click on the “Activate” button.
 The updated default Plesk Monitoring page[/caption]
After clicking on the “Activate” button, you’ll be redirected to the platform360.io website to confirm the 360 Monitoring activation. After the activation your free, full feature 14-day Pro trial will start. When your trial expires, your account will automatically downgrade to the Lite plan, unless you choose to keep all the Pro features by upgrading. The Lite plan is free of charge forever.
 The confirmation page[/caption]
After confirming, the extension will install a monitoring agent360 on the server. The agent will collect performance data about the server. The collected data will be available inside the Plesk Monitoring extension as well as the 360 Monitoring website. If you have only one server, you can perform popular operations within the extension.
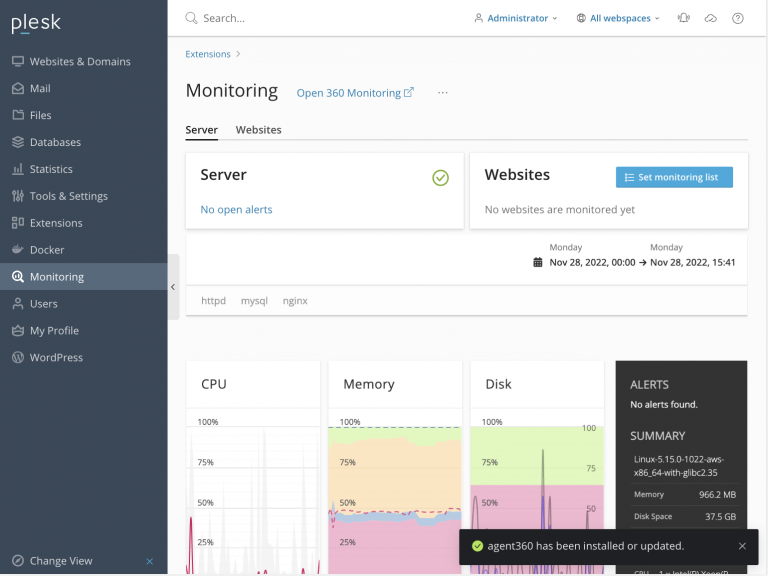 The Plesk Monitoring extension with connected 360 Monitoring[/caption]
On the other hand, for those of you that have many servers and want to see all the information about the servers in one place, use different dashboards and customize your own Status Pages, we suggest using the 360 Monitoring website.
4. Enable Website Monitoring
Once you have activated and configured your server monitoring, the final step is to enable website monitoring. On the Plesk Monitoring page, click “Set monitoring list” and enable websites that you want to monitor.
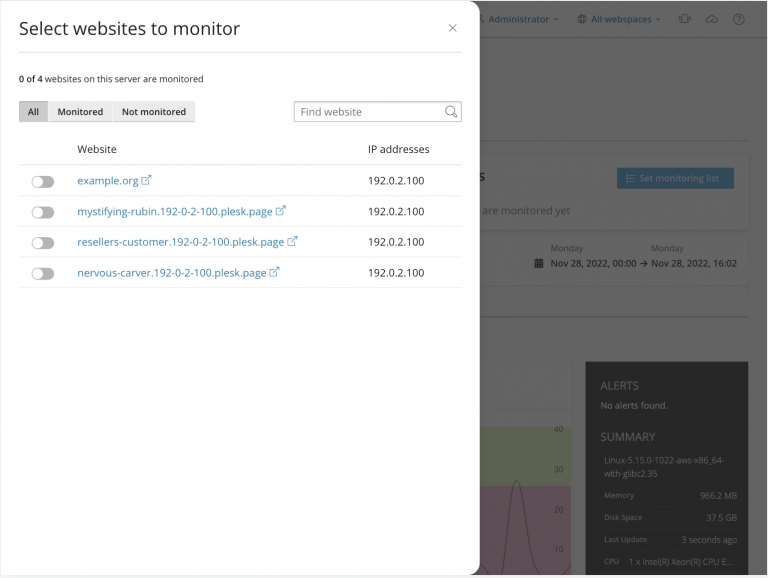 The Plesk Monitoring extension with “Set monitoring list” settings[/caption]
5. Test Server Shut Down
Now let’s verify that everything works as intended. I’m going to shut down the server to check what information I’ll receive from the 360 Monitoring service in case of failure. (This means that during the reboot the Plesk server with the Monitoring extension won’t be available and won’t be able to send you any information about its status).
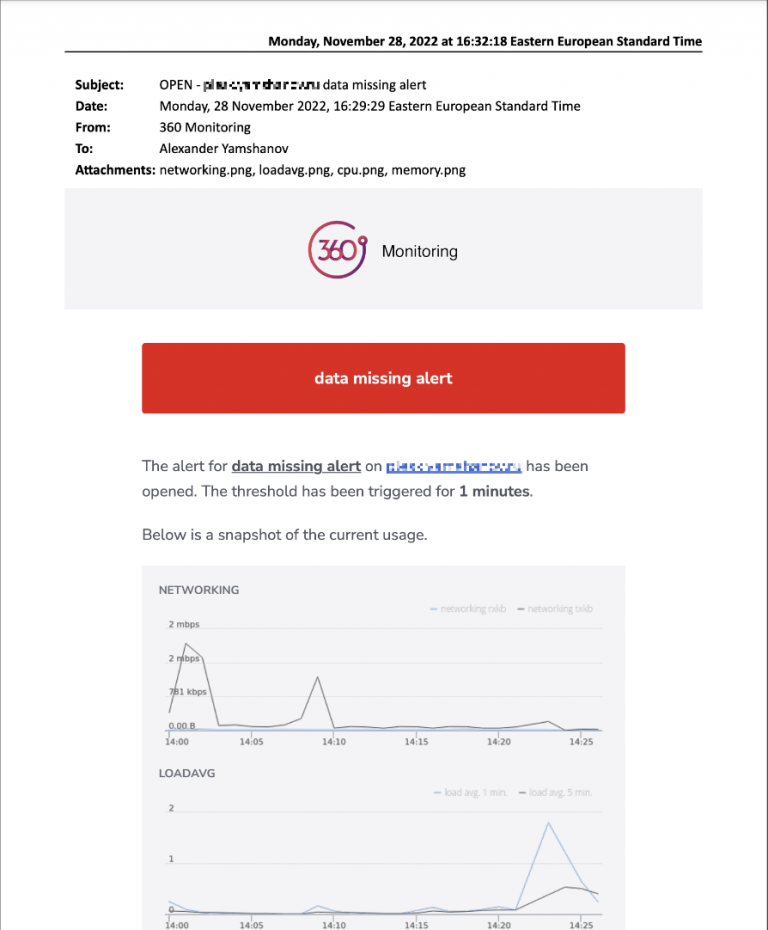 An email from 360 Monitoring service[/caption]
As you can see, I’ve received an email with information that the server has stopped sending any data. The email also contains graphs of some metrics for the 30 minutes prior to the failure. This helps to instantly understand what’s happening, for example, if the issue happened due to high load on CPU or memory, or due to some unexpected power or network failure.